
1-Page Summary1-Page Book Summary of Naked Statistics
Wheelan opens Naked Statistics with the admission that he sometimes struggled to see the relevance of what he was learning as a math student. Therefore, he puts the relevance of statistics front and center in the book, building his discussion of each statistics concept around why we should know about it. Better yet, Wheelan proves that statistics don’t need to be intimidating by putting the math behind statistics into digestible terms and explaining concepts with relatable, relevant, and even humorous examples.
This guide largely focuses on two main themes in Naked Statistics. First, we cover what many common statistics mean, how to interpret them, and why they matter. Like Wheelan, we use real and fictional examples to add context to each statistic covered. Second, we examine Wheelan’s discussion of the consequences of bias and the misapplication and misinterpretation of statistics to make the case that everyone should develop basic statistical literacy.
Statistics Organize Data
We rely on data to make sense of the world, but without statistics, datasets would be largely useless. Imagine asking a car salesperson what kind of mileage a car gets, only to get a 100-page spreadsheet of the individual miles that car has driven and how much gas it used each mile! While the spreadsheet may be comprehensive, it’s also pretty useless if you were hoping for a quick answer. With statistics, we can take unwieldy datasets and transform them into meaningful and actionable values, like average miles per gallon.
Statistics that summarize datasets are called descriptive statistics. Two of the most familiar and commonly used descriptive statistics are the mean (the average) and the median (the middle number when you put all of your data in numerical order). The mean and median are called measures of central tendency, and while they both tell us about the “middle” of a dataset, Wheelan explains that they can convey very different messages. With a basic understanding of statistics, we can learn when to use one over the other and spot when someone might be reporting the mean instead of the median (or vice versa) to further an agenda.
Say the beach authorities at a fictional beach were collecting data on the number of jellyfish stings swimmers suffered each week throughout the summer. The data might look something like this:
| Jellyfish Stings/Week/500 swimmers | |||||||||||
| June | July | August | Sept | ||||||||
| 0 | 0 | 0 | 0 | 0 | 0 | 0 | 1 | 3 | 50 | 150 | 300 |
(Shortform note: In this example, the dataset is naturally ordered, so we don't need to order it to determine the median.)
The mean number of jellyfish stings is 42. The median number of stings is zero. Beach authorities could either say:
A) “Visit our beach! The mean number of weekly stings/500 swimmers throughout the summer is only 42!”
or
B) “Visit our beach! The median number of weekly stings throughout the summer is zero!”
Neither of these statements is incorrect, but they convey a different message to prospective swimmers. The beach authorities are sure to advertise option B over option A because option B makes the beach look more attractive. As astute statistics students, we should question which measure of central tendency best captures the “story” of the dataset and be aware that no single statistic can fully convey real-world complexity.
The Utility of Central Tendency
Measures of central tendency are foundational to how we think about and communicate data. But as Wheelan cautions and our jellyfish example highlights, if they aren’t used with care, they can be unhelpful or even dangerous.
A TED Talk entitled “The Myth of Average” highlights how the misapplication of central tendency affected the United States Air Force in the 1950s. Despite having well-trained pilots and the most advanced airplanes to date, the Air Force was dissatisfied with pilots’ performance. Research on the dimensions of thousands of pilots revealed that the cockpits designed for the “average-sized” pilot didn’t fit any pilot well, and the ill-fitting cockpits prevented the pilots from flying their best. In response, the Air Force shifted its design focus from making cockpits that fit the average person to making cockpits that could accommodate the extremes of human dimensions. This shift improved the performance of existing pilots and allowed the Air Force to recruit the most diverse pool of fighter pilots in the world.
The lesson in this example is that a tool designed for the average user isn’t likely to be ideal for anyone. In many cases, such as a pair of scissors, we can easily accept this compromise. However, when it comes to life-altering scenarios such as flying a plane, we may want to rethink designs based on an average.
Statistics Reveal and Describe Relationships
Descriptive statistics can also illuminate and describe relationships between variables in a dataset. As Wheelan explains, **analyzing the correlation between two variables can tell us whether a change in...
Want to learn the ideas in Naked Statistics better than ever?
Unlock the full book summary of Naked Statistics by signing up for Shortform.
Shortform summaries help you learn 10x better by:
- Being 100% clear and logical: you learn complicated ideas, explained simply
- Adding original insights and analysis, expanding on the book
- Interactive exercises: apply the book's ideas to your own life with our educators' guidance.
Here's a preview of the rest of Shortform's Naked Statistics summary:
Naked Statistics Summary Shortform Introduction
Wheelan explains that learning statistics can make us more critical consumers of information and help us make informed decisions. As statistics students, we can learn to evaluate the information presented to us in political and marketing campaigns, on the news, in scientific publications, and so on, and put that information into useful context. Learning statistics will also help us spot misleading or misguided uses of data and statistics rather than being fooled by them.
Thanks to Charles Wheelan, statistics don’t need to be intimidating. Naked Statistics puts the math behind statistics into digestible terms and explains statistics concepts with relatable, relevant, and even humorous examples. Readers also benefit from additional socio-political insight from the book, as Wheelan uses real-world anecdotes to explore how statistics can inform collective decision-making.
About the Author
Charles J. Wheelan is a faculty member at Dartmouth College and a former faculty member at the University of Chicago, specializing in public policy. He holds a B.A. from Dartmouth College, a Master’s in Public Affairs from Princeton University, and a Ph.D. in Public Policy from the...
Naked Statistics Summary Why Learn Statistics?
The second half of Naked Statistics’s title, Stripping the Dread From the Data, tells readers why Wheelan’s book is a good choice if they are curious about statistics but apprehensive of a math-based book. Wheelan, a New York Times best-selling author, senior lecturer at Dartmouth College, and former senior lecturer at the University of Chicago, uses his skills as a teacher and storyteller to make analyzing data relatable, digestible, and entertaining.
As Wheelan explains, statistics are powerful tools for summarizing information and making inferences from data. He notes that people would have difficulty gleaning meaning from the mountains of data our society generates daily without them. Therefore, statistics make data meaningful and actionable.
The insights we generate with statistics help run society as we know it. For example, best practices in medicine and education are established via statistical analyses of data. Lawmakers use data to inform policy. Sports enthusiasts use data to discuss the skill and potential of their favorite players and teams, and the list goes on. We use statistics in so many ways that Wheelan reminds us that they inform our daily lives...
What Our Readers Say
This is the best summary of How to Win Friends and Influence People I've ever read. The way you explained the ideas and connected them to other books was amazing.
Naked Statistics Summary Using Descriptive Statistics to Describe Measures of Central Tendency
Now that we’ve established why learning statistics is important, we'll look at some basic statistics terms and concepts, starting with descriptive statistics. As their name suggests, descriptive statistics take information in a data set and condense it into a meaningful figure like an average or percentile.
When using descriptive statistics to summarize data, Wheelan explains that we always make trade-offs between complexity and utility. Any time we take data from the real world and condense it into a single value, we gain insight into the data as a whole but lose some of the nuance and the ‘story’ behind that data.
For example, say your local elementary school implemented a new reading program that improved overall student reading skills by 15%. Hooray! However, further analysis might show that those gains were concentrated in students from high-income families, and the reading skills of low-income students stayed roughly the same. In light of this more complete picture, it seems clear that the program needs to be modified.
As our reading program example shows, the descriptive statistics that we choose when summarizing data have a determining impact on the story the...
Naked Statistics Summary Using Descriptive Statistics to Summarize Data Distribution
As we've seen, measures of central tendency don’t give us the “full story” of a dataset. We can get a clearer picture of that story by combining central tendency with a description of the data’s distribution.
The Normal Distribution
The normal distribution is a foundational concept in statistics. A normal distribution refers to a dataset that forms a perfectly symmetrical bell curve around the mean when graphed as a frequency distribution (a visual representation of data where the height of the bars represents the number of times a specific outcome occurs).
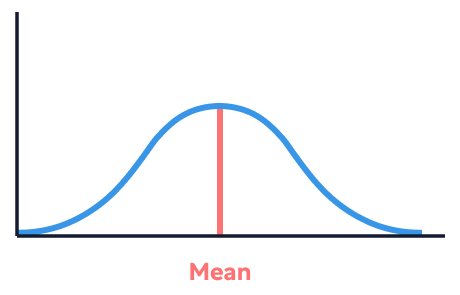
(Note that the mean and the median will be the same in a perfectly symmetrical distribution.)
When a dataset looks the same on either side of the mean, we say it's symmetrical. Symmetrical distributions feel intuitively familiar because, as Wheelan explains, they happen in real life all the time. For example, most babies start to crawl somewhere between six and 12 months, with an average of around nine months. Some will crawl earlier than six months, and some will crawl after 12 months, but the peak of our frequency...
Why people love using Shortform
"I LOVE Shortform as these are the BEST summaries I’ve ever seen...and I’ve looked at lots of similar sites. The 1-page summary and then the longer, complete version are so useful. I read Shortform nearly every day."
 Jerry McPhee
Shortform Exercise: Spot Misleading Statistics
Wheelan explains that anyone with the will and a capable computer program can perform statistical analyses. This accessibility combined with the ease and speed of information sharing in our technology-oriented culture makes it easy for misleading statistics to make their way into our lives and inform our opinions or decisions.
Think about the last time you read or were told a statistic that grabbed your attention. What was your initial impression of the statistic’s validity?
Naked Statistics Summary Using Probability to Make Decisions
Probability is another way to use descriptive statistics to make informed decisions.
Probability is a mathematical ratio that communicates the likelihood of a particular event over all other possible outcomes. Probability allows us to manage uncertainty by measuring risks and putting possible outcomes in perspective. Wheelan explains that understanding probability can be especially relevant to our daily lives because we make decisions based on our perception of probability all the time.
However, our perception of likely outcomes is often mathematically irrational. For example, the probability of getting in a car accident while driving to a beach is far higher than the probability of being attacked by a shark there, but we often—irrationally—fear the shark risk more.
We'll discuss some of the basic concepts and applications of probability next.
Probability Isn’t Intuitive
There are several reasons for our mathematically irrational perception of probability, including:
- Confirmation Bias: This is when we focus on what we expect and ignore the...
What Our Readers Say
This is the best summary of How to Win Friends and Influence People I've ever read. The way you explained the ideas and connected them to other books was amazing.
Naked Statistics Summary “Safe Assumptions” With Inferential Statistics
We’ve examined how descriptive statistics help us summarize and describe data, characterize relationships, and make predictions. Next, we'll move on to inferential statistics, which enable us to extrapolate beyond the data we collect and make inferences about how the world works.
Wheelan describes inferential statistics as the combination of data and probability. Just as probability is never a guarantee of an outcome, there are no definitive answers in inferential statistics. Rather, inferential statistics help us use what we do know to make math-based best guesses about what we want to know.
Inferential Statistics Don’t Provide a Mechanism
As Wheelan explains, inferential statistics are very effective at illuminating and describing relationships, but they can’t actually prove anything by themselves because they are based exclusively on numerical data that can’t capture the complexity of the real world. In other words, inferential statistics give us a compelling reason to believe that two variables are related but don’t supply a [mechanism for that...
Naked Statistics Summary Finding Answers With Regression Analysis
All of the statistics and data collection scenarios we've covered so far have been relatively straightforward because they’re primarily concerned with just one variable. However, Wheelan argues that many socially important research questions are “messy,” with intertwining variables spanning prohibitively long periods.
For example, say you wanted to know whether exposure to a particular chemical (we’ll call it chemical X) is associated with an increased risk of developing cancer. You can't hope to design a research study to test this question because exposing a group of people to a chemical you suspect causes cancer would be ethically problematic. Additionally, there are myriad other variables in addition to chemical exposure that affect people’s risk of developing cancer: smoking, genetics, diet, exercise, and so on. Finally, the risk of developing cancer is often measured throughout a lifetime. Researchers, understandably, want answers within their lifetimes.
In “messy” research scenarios, an inferential statistical tool called regression analysis can help us infer relationships between variables that we wouldn’t otherwise be able to study. **Regression analysis quantifies...
Want to read the rest of this Book Summary?
With Shortform, you can:
Access 1000+ non-fiction book summaries.
Highlight what you want to remember.
Access 1000+ premium article summaries.
Take notes on your favorite ideas.
Read on the go with our iOS and Android App.
Download PDF Summaries.
Shortform Exercise: Design a Study
Now that we've covered the potential and the pitfalls of inferential statistics, think about a question that you are interested in and how you could use statistics to help answer it.
What are your independent and dependent variables in this study? What are your null and alternative hypotheses?
Naked Statistics Summary Quality Data: The Backbone of Reliable Statistics
We've examined some of the most commonly used statistics that we're likely to encounter in our daily lives. However, understanding how to run statistical analyses is just a small part of the overall statistics process. Wheelan explains that, in a sense, the “math part” of statistics is the easy part since we do most statistical analyses on a computer, and the statistics formulas themselves are unchanging and easy to look up. Therefore, once we know enough about statistics to understand which formulas to use and what the resulting statistics mean, the calculations component is simply a matter of plugging data into our chosen equations.
Since statistics themselves are relatively “easy” to calculate, Wheelan explains that well-meaning people produce misleading statistics all the time. He notes that many of the statistics we encounter are mathematically precise (if you repeated your calculations you’d get the same result) but factually inaccurate (even though your numbers are “tight,” they’re wrong). In other words, the numbers hold up to scrutiny but they don’t accurately explain a situation.
For example, you could use statistics to present a compelling [link between...
What Our Readers Say
This is the best summary of How to Win Friends and Influence People I've ever read. The way you explained the ideas and connected them to other books was amazing.
Naked Statistics Summary Reducing Bias in Data
Now that we've discussed some of the challenges and strategies for data collection, we'll review Wheelan’s discussion of the reliability of our data itself.
One of the most important characteristics of reliable data is that it provides a true representation of the population we're studying. As we discussed in our section on inferential statistics, many research projects and statistical analyses rely on sampling as a way to learn about a larger population. If the data collected in our sample doesn't accurately represent our population, then our resulting statistics will be unreliable. Wheelan highlights two main ways to ensure a representative sample:
Random Sampling: A truly random sample is ideal for data collection. Random sampling allows us to be reasonably confident that we're capturing the diversity of the underlying population because any individual has as much chance as any other of being selected. Therefore, the diversity of the sample should be close to the diversity of the population. When a sample accurately reflects the composition of its population, it's referred to as a “representative sample."
Large Sample Sizes: The larger our sample size,...
Shortform Exercise: Examine Your Sources of Bias
Consider the following hypothetical research scenario:
Researchers interested in the effect of yoga and meditation on emotional wellbeing set up a booth at a large ashram on the last day of a week-long yoga retreat. (Their null hypothesis is that participating in yoga and meditation every day has no impact on emotional well-being.) As participants leave the retreat, many stop by the booth to fill out the researchers’ questionnaire, where they are asked whether they believe that yoga and meditation have a positive impact on their emotional well-being and to rate their sense of emotional well-being today compared to the first day of the retreat. Using this data, the researchers reject their null hypothesis and publish a paper entitled: “Daily Yoga Practice Universally Improves Emotional Well-Being.”
What sources of selection bias can you identify in this study? (Remember, selection bias happens when our sample is not random, and certain subsets of the population are over- or underrepresented.)
What Our Readers Say
This is the best summary of How to Win Friends and Influence People I've ever read. The way you explained the ideas and connected them to other books was amazing.

 1-Page Summary
- Shortform Introduction
- Why Learn Statistics?
- Using Descriptive Statistics to Describe Measures of Central Tendency
- Using Descriptive Statistics to Summarize Data Distribution

 Exercise: Spot Misleading Statistics
- Using Probability to Make Decisions
- “Safe Assumptions” With Inferential Statistics
- Finding Answers With Regression Analysis
- Exercise: Design a Study
- Quality Data: The Backbone of Reliable Statistics
- Reducing Bias in Data
- Exercise: Examine Your Sources of Bias