
This article is an excerpt from the Shortform book guide to "Crossing the Chasm" by Geoffrey Moore. Shortform has the world's best summaries and analyses of books you should be reading.
Like this article? Sign up for a free trial here .
What is technological maturity? How do you measure the maturity of a technology?
There are a number of models that can be used to chart the maturity of a technology. The TRL (Technology Readiness Level) is the most common tool for measuring the maturity of a technology in terms of its evolution (from basic concept to an actual working system). The TALC (Technology Adoption Life Cycle), on the other hand, measures technological maturity in terms of the degree of its adoption by the market.
In this article, we’ll take a look at how the two systems overlap.
The Technology Adoption Life Cycle (TALC)
The TALC, also known as “diffusion of innovation,” was developed by Beal and Bohlen, two agricultural extension agents working for Iowa State College in the 1950s. They developed the model based on studies of when farmers started using new agricultural innovations, such as fertilizer and hybrid seed corn. Others soon generalized the model to technological innovations outside of agriculture.
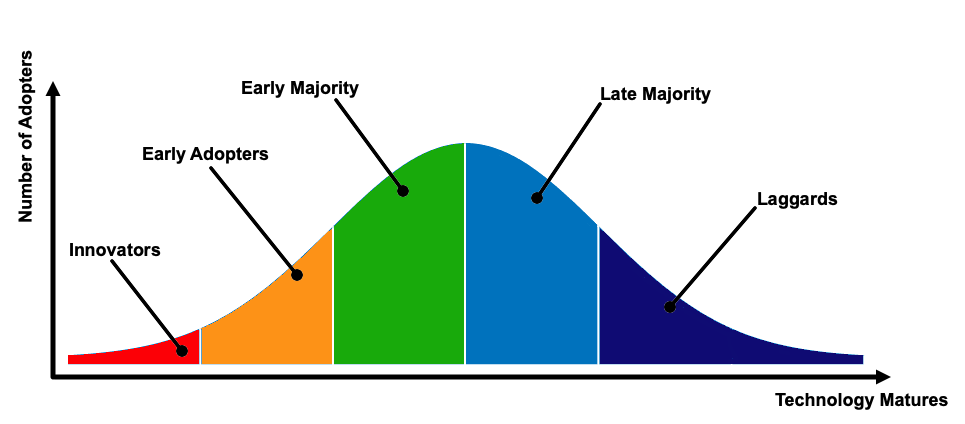
The TALC predicts that as a technology matures, the number of potential new buyers first increases (as the technology starts to catch on) and then decreases (as you run out of potential customers who haven’t already bought it), following the profile of a bell curve. The area under the curve represents the total number of customers for the new technology. This area is divided into five psychographic categories (classifications by psychological and demographic criteria) of prospective customers. Technological maturity is represented by the horizontal axis.

TRL vs. TALC
The TRL system only partially overlaps with the scale of technological maturity shown in the TALC:
TRL-1 through TRL-3 denote levels of preliminary scientific research and development. At this point, there is no product to sell, so this region of technological maturity lies completely to the left of the TALC curve.
TRL-4 through TRL-6 represent stages of laboratory R&D, component development, and proof-of-concept prototype testing. It is possible that you might work with a few innovators outside the company (under a NDA) during this period, but even at TRL-6 your product is only ready for preliminary proof-of-concept demonstrations. Thus, the technology maturity scale on the TALC graph starts at about TRL-6.TRL-7 and TRL-8 represent increasingly sophisticated prototypes, such as beta versions that you might sell to innovators or demonstrate to early adopters to get an order for a custom solution tailored to their application.
The official TRL system ends at TRL-9, which denotes a technology that has been used successfully in the field. Thus, by the time you have completed your first full system installation for an early adopter, your product should be at TRL-9.
Perhaps the TRL-system could be extended to cover the rest of the TALC. For example:
- TRL-10 could denote the point where the technology is recognized in industry standards. On the graph, this would be near where the early majority section begins.
- TRL-11 could denote widespread proliferation of the technology, or more precisely, the point under the peak of the curve, where at least half of the potential customers have already adopted it.
- TRL-12 could denote the point where the technology is considered essential for routine operations in its applicable context. On the graph, this would be in the laggard region.

———End of Preview———
Like what you just read? Read the rest of the world's best book summary and analysis of Geoffrey Moore's "Crossing the Chasm" at Shortform .
Here's what you'll find in our full Crossing the Chasm summary :
- An explanation of the chasm phenomenon that many new high-tech products face
- How to pilot a product across this chasm to mainstream success
- The problems with the Technology Adoption Life Cycle (TALC) model


