
This article is an excerpt from the Shortform book guide to "Naked Statistics" by Charles Wheelan. Shortform has the world's best summaries and analyses of books you should be reading.
Like this article? Sign up for a free trial here .
What is the standard deviation in statistics? What can the standard deviation tell about a data set?
The standard deviation is descriptive statistics that measures the degree of dispersion in a given data set. More specifically, standard deviation tells us how far each value is from the mean.
Here’s what we can glean from the standard deviation, explained in simple terms.
The Standard Deviation
We can describe how “spread out” a dataset is around its mean by using a descriptive statistic called the “standard deviation.” Once we know the standard deviation, we can make statements like “Value X is one standard deviation above the mean” or “Value Y is two standard deviations below the mean.”
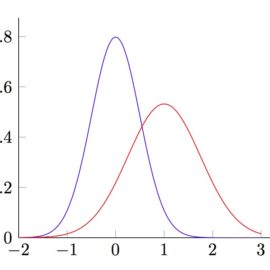
As Wheelan explained the standard deviation will be relatively small when data clusters tightly around the mean and relatively large when the data is spread out.
In the image below, Dataset One has a smaller standard deviation than Dataset Two.
We can often intuit which of two datasets is likely to have a larger standard deviation than the other. For example, say we have two hypothetical datasets: Dataset One is a collection of the average typing speed, in words per minute, of 100 professional typists. Dataset Two is a collection of the average typing speed, in words per minute, of 100 randomly selected people at the local library.
We can reasonably guess that Dataset One will have a smaller standard deviation than Dataset Two because we know that professional typists all type fast. Therefore, most of the values in Dataset One likely cluster around a similar fast typing average (the mean). In contrast, we’re likely to find a mix of slow and fast typists at the local library, meaning the values in Dataset Two will be more spread out.
Z-Scores
An additional statistic that is often reported alongside the standard deviation is the z-score. The z-score pinpoints precisely how far a particular data point is from the mean in a normal distribution. It’s measured in standard deviations. A z-score of zero means that a particular data point is the same as the mean. A z-score of -1.5 means the data point is 1.5 standard deviations smaller than the mean. A z-score of 2.6 means that a data point is 2.6 standard deviations larger than the mean.
The z-score is useful when we’re interested in how a particular piece of data compares to the dataset as a whole. For example, say you catch a fish that looks particularly large. You look up the mean size and standard deviation for that fish species and calculate a z-score of 2.5 for the fish you caught, meaning your fish was 2.5 standard deviations above the average-sized fish of that species.

———End of Preview———
Like what you just read? Read the rest of the world's best book summary and analysis of Charles Wheelan's "Naked Statistics" at Shortform .
Here's what you'll find in our full Naked Statistics summary :
- An explanation and breakdown of statistics into digestible terms
- How statistics can inform collective decision-making
- Why learning statistics is an exercise in self-empowerment


