This article is an excerpt from the Shortform book guide to "Your Money or Your Life" by Vicki Robin and Joe Dominguez. Shortform has the world's best summaries and analyses of books you should be reading.
Like this article? Sign up for a free trial here .
Do you know how to use a personal financial graph? Do you know how it can help you achieve financial freedom?
In Your Money or Your Life, Vicki Robin and Joe Dominguez include using a financial graph as a step toward reaching financial independence. They share three benefits of charting your income and expenses, and they provide three steps for setting up your graph.
Read more to learn how to use a financial graph to achieve financial freedom.
A Financial Graph Is One Step Toward Financial Independence
One step in this program to achieve financial independence is visualizing your expenses and income on a hand-drawn or digital chart. Your financial graph will offer a clear representation of your finances over time, providing motivation to reduce your spending, pay down your debt, and build your savings.
First, we’ll tackle how to find the motivation to continue with the program at this point. Then, we’ll outline how to complete this step, followed by a discussion of the benefits it will afford you over time—including reaching financial independence.
How to Keep Going
At this point, you may find it tempting to stop following the program. Perhaps you feel the first steps have only confirmed what you already knew, that you’re deeply in debt or spend money on things that don’t make you feel fulfilled.
If you follow the steps of this program, you’ll eventually achieve financial freedom. But it requires persistently working through the steps, and developing this habit takes time.
Here are three tips to keep moving forward:
- Consistently do the steps. Don’t consider them optional—work on them even if you don’t feel motivated to do so. Over time, it will start to feel less like a chore and more like a part of everyday life, just like taking a shower.
- Hold yourself accountable by sharing your progress with someone else. Just like exercising with a buddy, regularly discussing your experience with another person motivates you to do the work and improve. This could take many forms, from weekly check-ins to giving someone access to your online expense tracking tool.
- Create a graph to be able to track your monthly income and expenses. This is Step 5!
Graph Your Income and Expenses
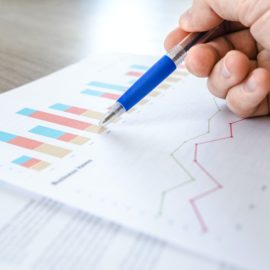
Charting your income, expenses, and savings over time will help you visualize your path to financial independence and stay motivated.
Decide if you want to make a paper chart or a digital one. Though programs like Microsoft Excel offer nice charts, a paper one is useful because you can hang it somewhere you will see it—and feel inspired by it—every day. Seeing it each day reminds you of why you’re following the steps—to spend less than you earn, climb out of debt, and increase your savings.
If you go with paper, get a sheet of graph paper that can accommodate up to 10 years of data. Choose an 18 by 12-inch piece of lined graph paper, or 36 by 24-inches. (If you can’t find graph paper, you can line a large blank sheet of paper yourself.)
Setting Up Your Financial Graph
- On the horizontal, or x-axis, mark out time in months. Allow room for 5-10 years (60-120 months).
- On the vertical, or y-axis, mark out dollars. Start with 0, and allow enough room for your income to double, even if that feels impossible at the moment. Create a scale that causes your larger figure for this month—income or expenses—to be recorded halfway up the axis. For example, if your income this month is $3,500 and your expenses are $3,200, make the $3,500 mark of your vertical axis fall about in the middle.
- Each month, mark your monthly income and expenses. It’s helpful to use two different colors: one for monthly income, and one for monthly expenses. Draw a line from the current month to the previous month. Over time, your chart will look something like this:
The Benefits of Step 5
Completing this step each month offers several concrete benefits that will put you on the path to financial independence:
- You’ll strive to earn more than you spend.
- You’ll pay off your debts.
- You’ll build savings.
1. Earn More Than You Spend
The graph serves as a potent visual reminder of what you’re working toward—making the gap between your income and spending larger. This is your savings. By following each of the steps in this program, you can expect to lower your expenses by about 20 percent.
But take caution—after doing Step 4, you may be tempted to severely restrict your spending in certain categories. Though this will decrease your spending, it often isn’t sustainable in the long-term. For example, if you’re eating only beans and rice in an attempt to save money, you’ll likely see a decrease in your spending. But this is very restrictive, and you may feel like you don’t have enough variety in your diet to do it long-term. After one month, once you confirm that you can restrict your food spending, you may ease the restrictions, returning your food costs to what they used to be.
Rather than taking on severe restrictions you won’t be able to maintain in the long-term, simply ask the questions from Step 4, expand your chart through Step 5, and choose some strategies to reduce your spending in Step 6. This will naturally orient you toward spending within your means.
2. Pay off Your Debts
In order to become financially independent, you need to pay off your debt. When you no longer have debt to pay, those dollars are freed up for you to use elsewhere.
If you don’t proactively pay down your debt—paying more than you owe—you lower your income, and by extension, your savings, over time. For example, if you pay exactly what you owe on your thirty-year mortgage, you can end up paying 2-3 times the sales price of the house due to accumulating interest.
Your financial graph can motivate you to find creative ways to pay off debt faster and dissuade you from taking on more. For example, some people choose to forgo using credit cards altogether in order to avoid going further into debt and to encourage themselves to spend less money. Others have decided to take on a housemate to help pay down their mortgage faster.
3. Build Savings
Many people in the US are financially insecure and have little to no savings. A 2015 study found that 47 percent of people in the US would struggle to pay an unexpected $400 payment.
But the faster you save money, the more quickly you’ll reach financial independence. Once you pay off your debts, it becomes even easier to save money because you can save what you used to pay toward debt. Then, you can devise ways to boost your savings, such as cutting back on spending or adding income.
Over time, as you live within your means, work to pay off your debts, and increase your income (more on this in Steps 7-9), the space on your graph that represents savings will grow.
Now you should be able to see how using a financial graph can help you achieve financial freedom. You’re on your way!

———End of Preview———
Like what you just read? Read the rest of the world's best book summary and analysis of Vicki Robin and Joe Dominguez's "Your Money or Your Life" at Shortform .
Here's what you'll find in our full Your Money or Your Life summary :
- The 9 steps to reach financial independence
- How to change your entire relationship with money and live a more meaningful life
- How to align your spending habits with your values, purpose, and dreams


