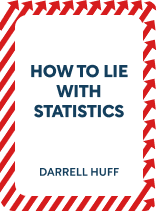

This article is an excerpt from the Shortform book guide to "How to Lie With Statistics" by Darrell Huff. Shortform has the world's best summaries and analyses of books you should be reading.
Like this article? Sign up for a free trial here .
How do companies get away with misleading customers into buying their products? How can statistics be manipulated for deceptive advertising?
If a company can’t find a statistic that makes them look good, then they resort to plan B: deceptive marketing. The top two methods for this are to either focus on semi-related figures or to attribute correlation to causation.
Learn more about these deceptive advertising techniques below.
Deceptive Advertising Techniques
If liars can’t find a statistical calculation that gives them figures they like, another technique they use is to focus on other figures that do seem to support what they have to say. This deceptive advertising technique isn’t technically “lying” so they can get away with it.
There are two techniques liars use to do this:
Technique #1: Citing Semi-Related Figures
If liars can’t prove something, sometimes, they’ll prove something else that sounds like it’s the same as what they were trying to prove.
- For example, if a cold medicine company can’t prove that their drug cures colds, but they can prove that it kills germs in a lab, they might advertise that their medicine “kills 15,000 germs.” Killing germs isn’t the same as curing colds (colds probably aren’t even caused by germs), but they’re close enough that people might think the medicine actually works.
Note that in some cases, the semi-related figure can actually give a more accurate picture of the situation than the direct figure.
- For example, the number of deaths a disease has caused is often a better indication of its incidence than the number of cases of it, because the record-keeping around fatalities is more robust.
Technique #2: Attributing Correlation to Causation
The next deceptive advertising technique involves pushing the idea that if there’s a relationship between two factors, one of them caused the other, and whichever factor is most favorable to a liar’s argument is the cause.
- For example, one study found that smokers got lower grades at college. A non-smoking activist with an agenda might report this as “If you stop smoking, your grades will improve.”
This is misleading because:
1. It’s often impossible to know which factor is the cause and which is the effect.
- For example, people struggling with the stress of bad grades could be driven to smoking for relief: In other words, bad grades could be the cause of smoking, not the effect of it.
Sometimes, the two factors are so interrelated they both act as both cause and effect.
- For example, stock ownership and income are probably both causes and effects at the same time. The higher your income, the more stocks you can afford, and since stocks make you money, the more stocks you have, the higher your income will be.
2. Both factors may be effects of some other cause. While the relationship between the factors is real, the cause-and-effect is uncertain.
- For example, maybe the same people who smoke are the same people who have low grades because they like socializing more than studying.
3. The relationship between the two may be only due to chance.4. Even if there is a real cause-and-effect relationship, that doesn’t mean it applies to everyone. Correlations are tendencies.
- For example, while it’s fairly conclusive that people who get a post-secondary education have higher incomes than those who don’t, that doesn’t mean that you will make more money if you go to college than if you don’t. (It’s also unknown if the people who make more money and also went to college might still have higher salaries even if they hadn’t gone to college—college attracts bright, rich people who already had a better chance at making more money.)
5. Correlations can be caused by humans and trends, rather than the factor you think they’re caused by.
- For example, older women tend to walk with their toes farther apart than younger women. This is because posture trends changed over the years, not because women’s posture necessarily changes as they age (which is what some people may assume).
An advanced version of misleadingly attributing correlation to causation is to presume that the correlation extends beyond the data. For example, a study might find more rain results in better crops, and someone might assume that this correlation holds in all circumstances: in other words, that more and more rain always results in better crops. However, that relationship doesn’t hold forever—if the rain is so heavy it causes floods, the crops will suffer.

———End of Preview———
Like what you just read? Read the rest of the world's best book summary and analysis of Darrell Huff's "How to Lie With Statistics" at Shortform .
Here's what you'll find in our full How to Lie With Statistics summary :
- The 10 ways you might end up fooled by statistics
- How to differentiate between legitimate and lying statistics
- Why you can't even trust a graph


